
Math Drills · Grade 2 (Elementary School)
Tables and Graphs
3 free maths worksheets for “Tables and Graphs” in Grade 2 (Elementary School). Download the question and answer PDFs and print them, no sign-up needed.
WorksheetsWhat this unit covers
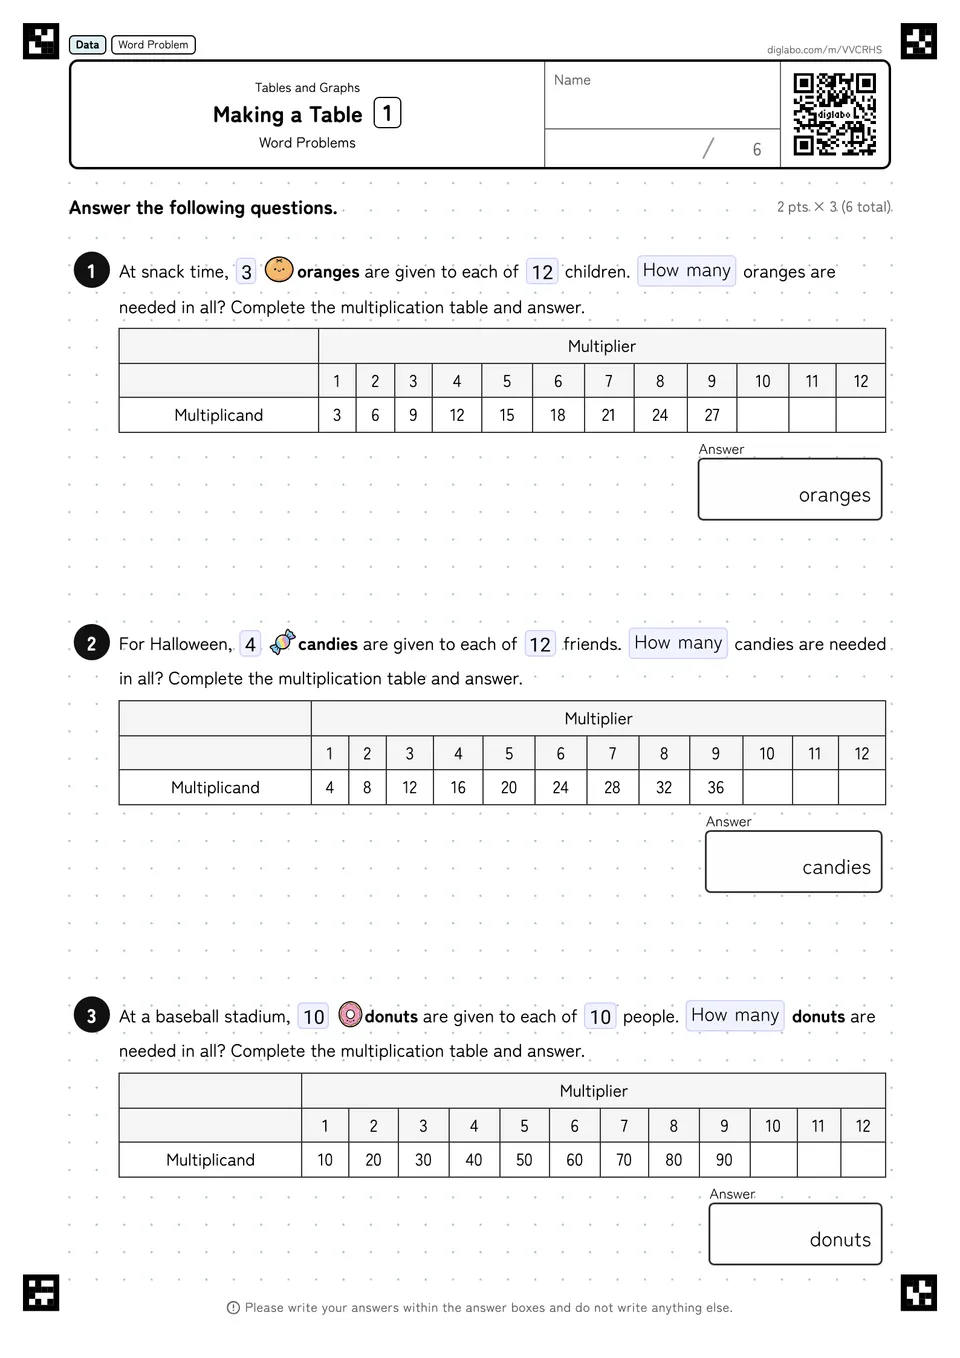
Scattered records are counted by category, organized into a table, and then read. Through Finding the Answer by Making a Table, children pick up a way of counting that misses nothing, along with the habit of reading totals and differences straight off the numbers in the table.
Following items by eye without marking them off leads to counting one twice or missing it, and the total stops matching the number of items. Checking the total cell against the sum of the categories reveals it. Reading rows for columns and answering with a number from the wrong column also happens.
Up to now a count was simply written down as the answer; here the work of sorting a count by category and organizing the results into a table appears for the first time. This experience of lining up numbers and arranging them leads into Tables and Bar Graphs in grade 3, which reads a table back out as a bar graph.
Learning steps
Worksheets
Frequently asked questions
- What do the “Tables and Graphs” worksheets for Grade 2 (Elementary School) practice?
- They cover problems such as Finding the Answer by Making a Table.
- How many “Tables and Graphs” worksheets are there for Grade 2 (Elementary School)?
- 3 worksheets are free to use. Every one is a printable PDF and comes with an answer key.