
Math Drills · Grade 4 (Elementary School)
Line Graphs and Tables
12 free maths worksheets for “Line Graphs and Tables” in Grade 4 (Elementary School). Download the question and answer PDFs and print them, no sign-up needed.
WorksheetsWhat this unit covers
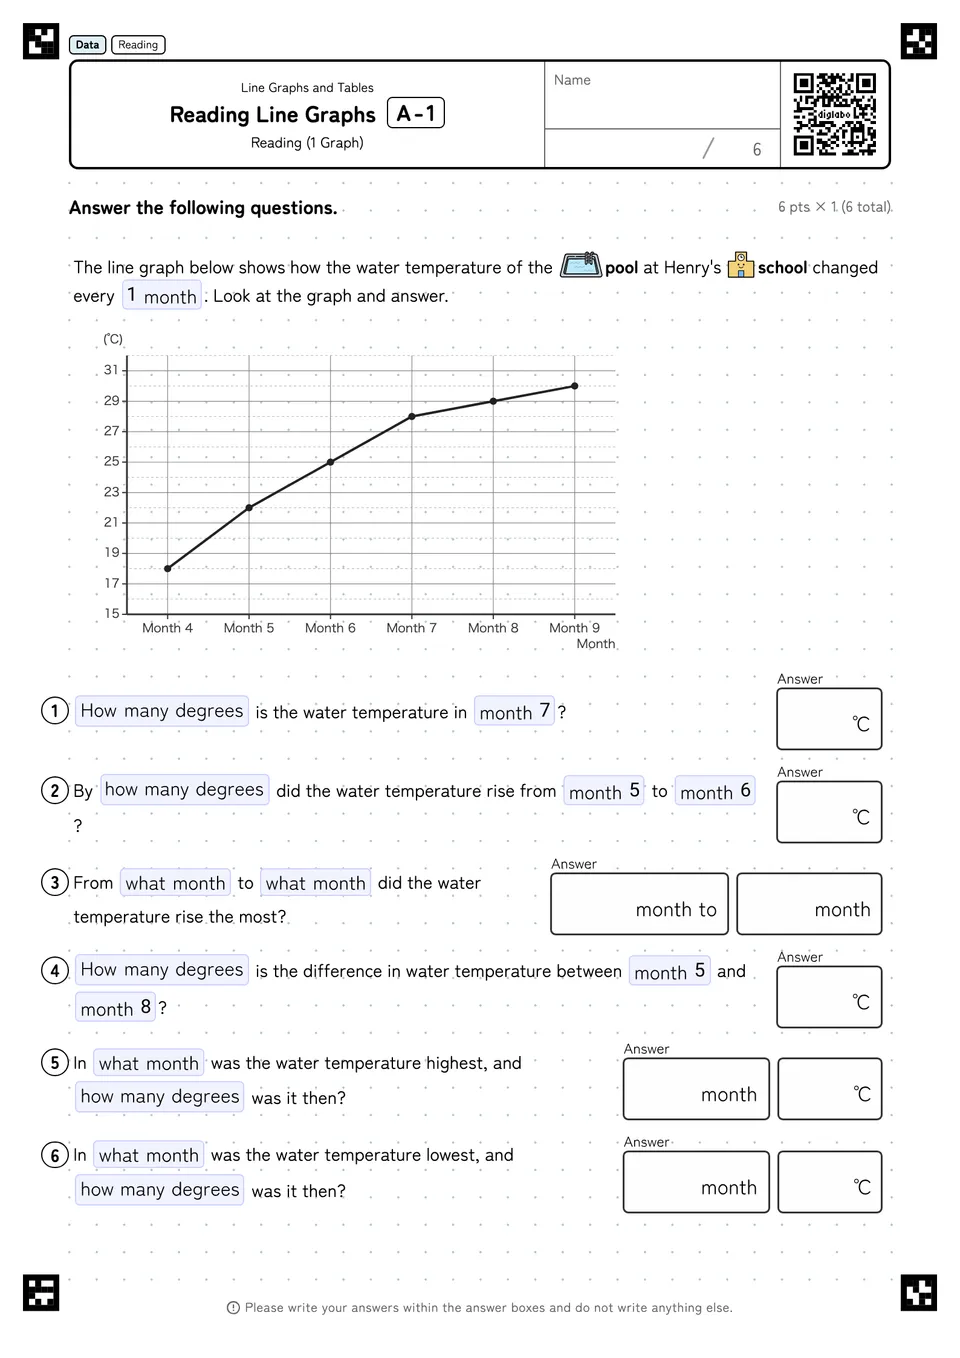
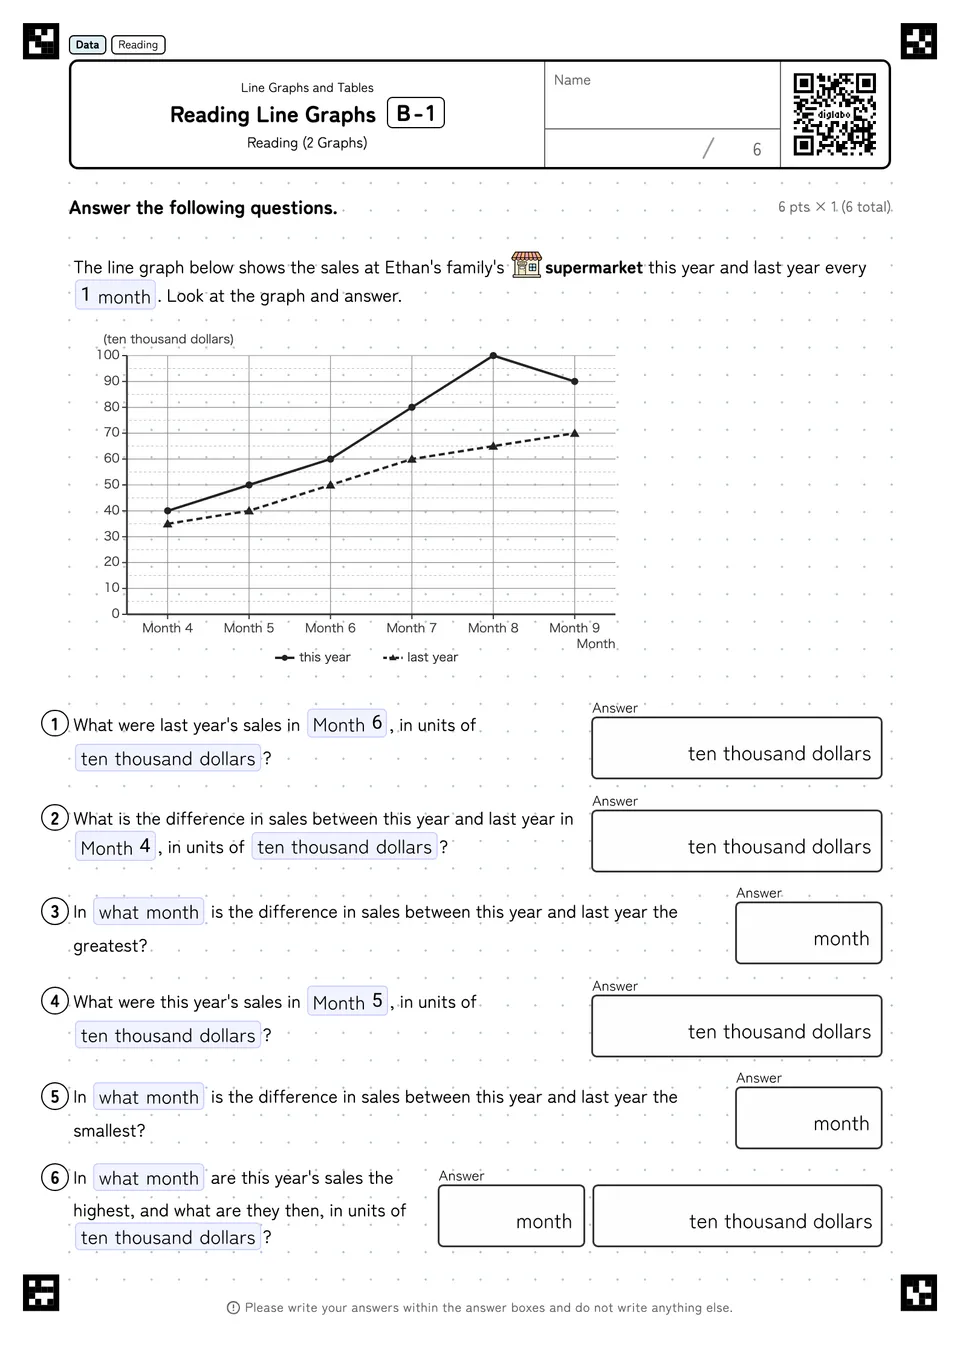
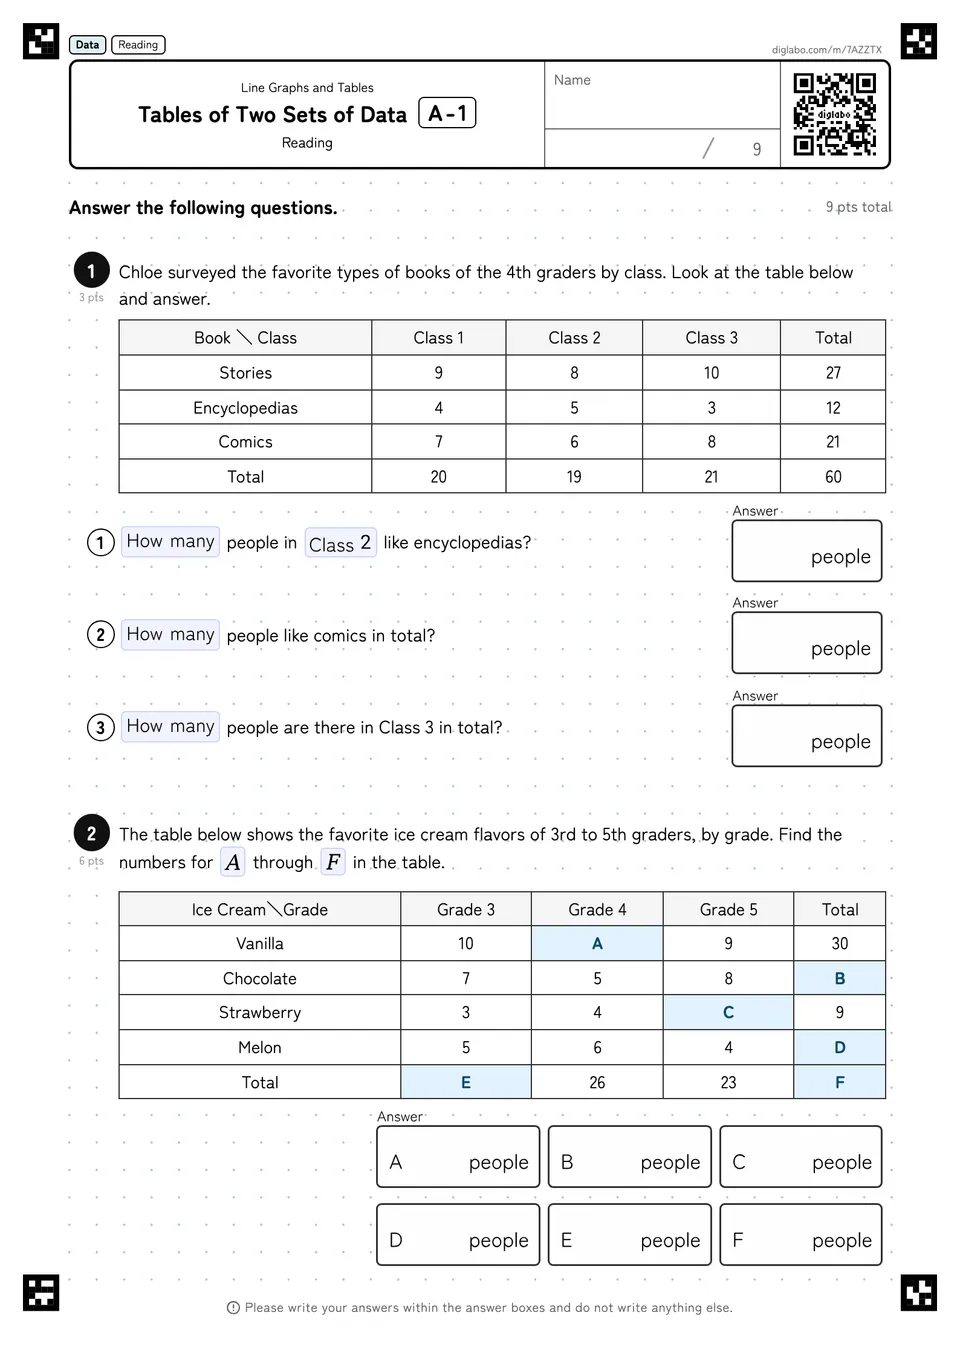
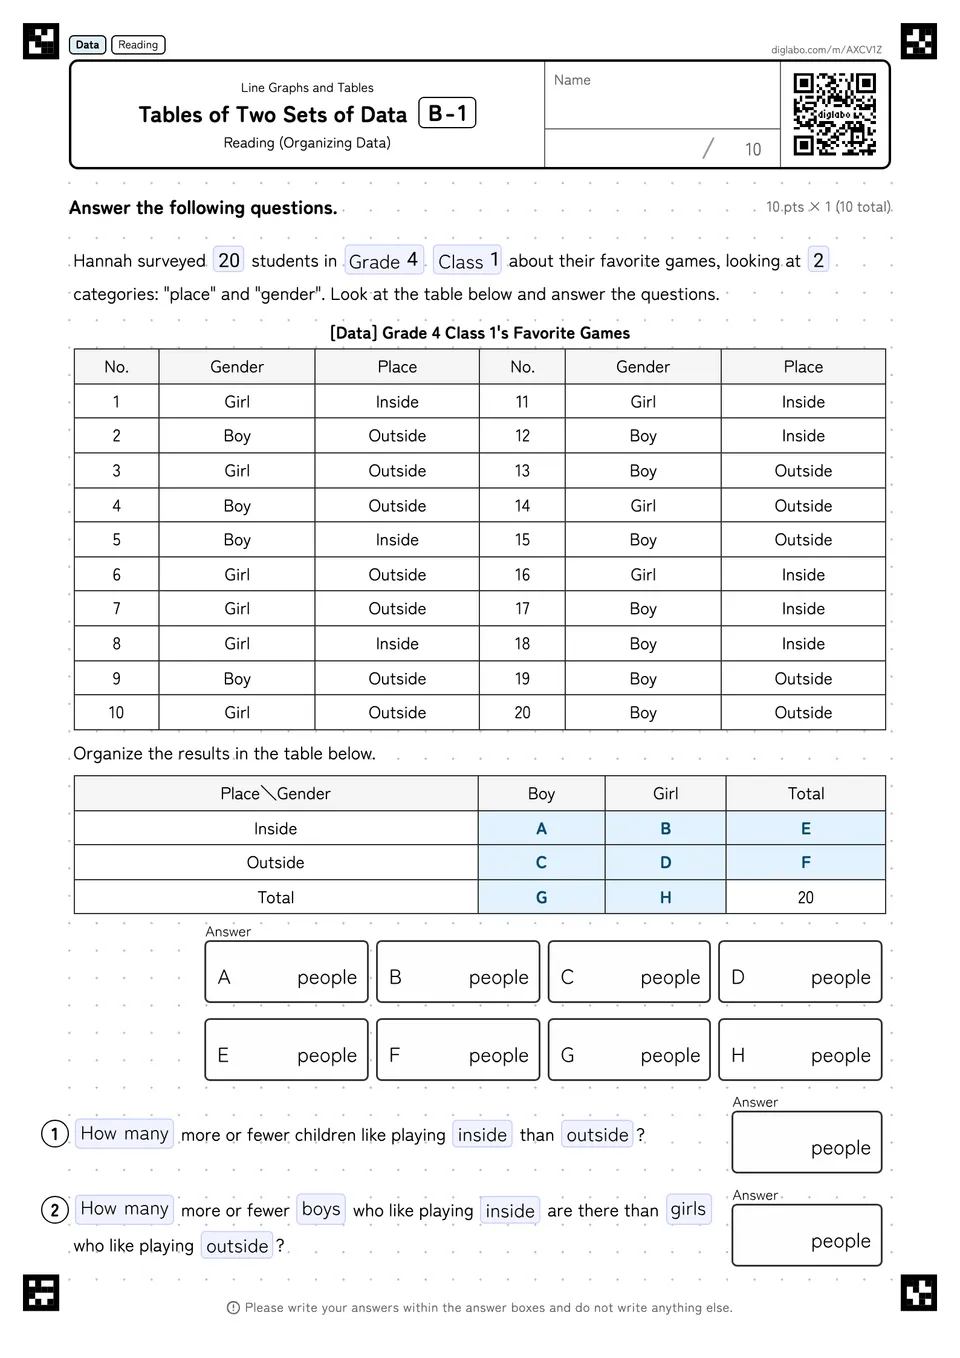
A quantity that changes over time is read off a line graph. The work moves from One Graph to Two Graphs laid over each other for comparison, and tables covering two attributes are worked through by hand in Reading (Multiple Questions), Filling in the Table and Organizing Data (Making a Table).
When one division on the vertical axis stands for 2 or 5, children read the number of divisions as the value itself. An answer that is half or a fifth of the real one identifies this. In Filling in the Table, the row and column totals get added into the total cell a second time, so the grand total alone is doubled.
Only a single set of figures was read at a time in Tables and Bar Graphs in grade 3; here that number doubles, and change over time is captured by a line instead of by height. This habit of extracting a trend from a picture returns in grade 5, when Band Graphs and Pie Charts asks for a share to be read from an angle or a length instead.
Learning steps
Worksheets
Reading Line Graphs
Frequently asked questions
- What do the “Line Graphs and Tables” worksheets for Grade 4 (Elementary School) practice?
- They cover problems such as One Graph, Two Graphs, Reading (Multiple Questions), Filling in the Table, Organizing Data (Making a Table).
- How many “Line Graphs and Tables” worksheets are there for Grade 4 (Elementary School)?
- 12 worksheets are free to use. Every one is a printable PDF and comes with an answer key.