
Math Drills · Grade 3 (Elementary School)
Tables and Bar Graphs
6 free maths worksheets for “Tables and Bar Graphs” in Grade 3 (Elementary School). Download the question and answer PDFs and print them, no sign-up needed.
WorksheetsWhat this unit covers
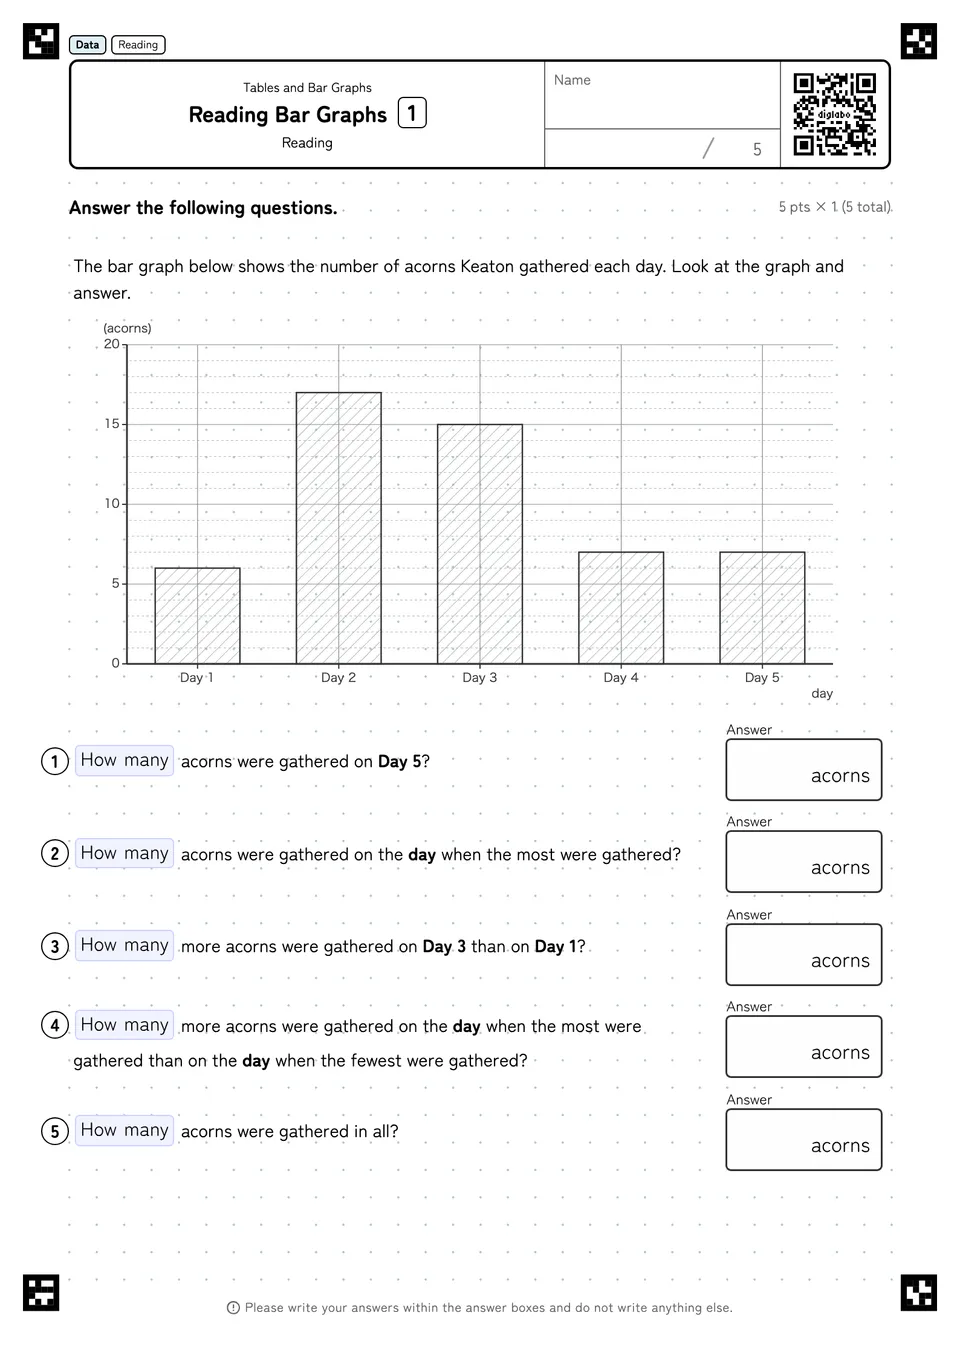
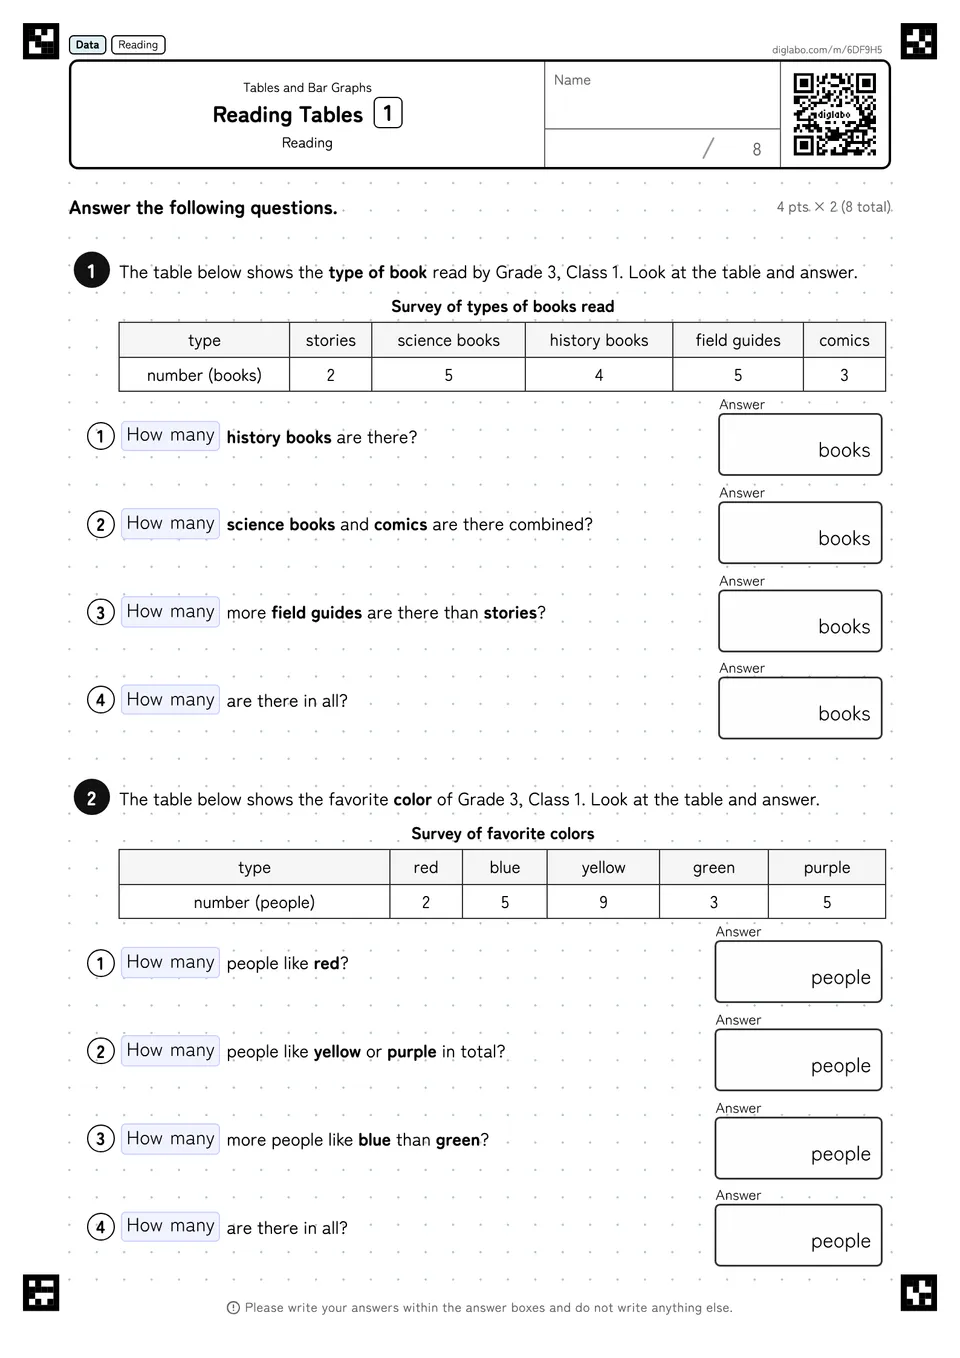
Numbers are read off a bar graph and a table, and the piece each question needs is pulled out. Several questions rest on the same source: checking what one division stands for, picking out the largest category, and comparing two quantities, answered one after another.
Assuming one division is 1 makes every answer a fraction of the real value on graphs scaled in fives or twos. Writing only the height of the bar identifies this. In tables, children also count the total row as though it were another category, and name the wrong item as the largest.
Picking up from Tables and Graphs in grade 2, where making a table was the focus, this unit moves on to reading data and answering questions about it. Working with only a single table or graph at a time, this scope leads into Line Graphs and Tables in grade 4, which compares two sources side by side.
Learning steps
Worksheets
Frequently asked questions
- What do the “Tables and Bar Graphs” worksheets for Grade 3 (Elementary School) practice?
- They cover problems such as Reading (Multiple Questions).
- How many “Tables and Bar Graphs” worksheets are there for Grade 3 (Elementary School)?
- 6 worksheets are free to use. Every one is a printable PDF and comes with an answer key.